Effect Evaluation
Benchmarks
This document shows the experiments we do and the results we get. Here we do two series of experiments. First, we experiment on a single node to show the recalls of the modified IVFPQ model which is based on faiss. Second, we do experiments with Vearch cluster.
We evaluate methods with the recall at k performance measure, which is the proportion of results that contain the ground truth nearest neighbor when returning the top k candidates (for k ∈{1,10,100}). And we use Euclidean neighbors as ground truth.
Note that the numbers (especially QPS) change slightly due to changes in the implementation, different machines, etc.
Getting data
We do experiments on two kind of features. One is 128-dimensional SIFT feature, the other is 512-dimensional VGG feature.
Getting SIFT1M
To run it, please download the ANN_SIFT1M dataset from
http://corpus-texmex.irisa.fr/
and unzip it to the subdirectory sift1M.
Getting VGG1M and VGG10M
We get 1 million and other 10 million data and then use deep-learning model vgg to get their features.
Getting VGG100M , VGG500M and VGG1B
We collect billions of data and use deep-learning model vgg to get their features for cluster experiments.
Nprobe experiments
We do experiments on SIFT1M, VGG1M and VGG10M. In this experiment, nprobe ∈{1,5,10,20,30,40,50,80,100,200}. At the same time, we set the ncentroids as 256 and the nbytes as 32.
We use recall at 1 to show the result.
Result
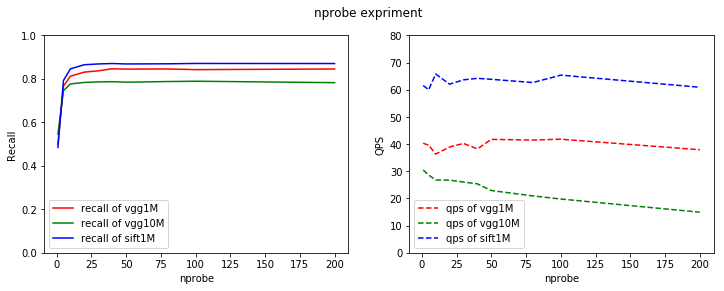
As we can see, when nprobe exceeds 25, there is no obvious change of recalls. Also, when nprobe get larger,only QPS of vgg10M get smaller, QPS of vgg1M and QPS of sift1M basically have no changes.
Ncentroids experiments
We do experiment on VGG10M. The number of centroid ∈{64,128,256,512,1024,2048,4096,8192} and we set nprobe as 50 considering the number of centroid becomes very large. Here we also set nbytes as 32. We use recall at 1 to show the result.
Result
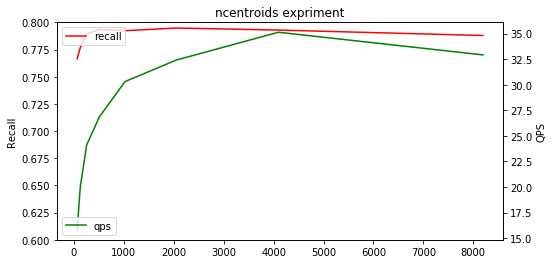
As we can see, there is no obvious change of recalls when the number of centroid get larger. But the QPS become higher and higher as the number of centroid grows.
Nbytes experiments
We do experiment on VGG10M. The number of byte ∈{4,8,16,32,64}. We set ncentroids as 256 and nprobe as 50. We use recall at 1 to show the result.
Result
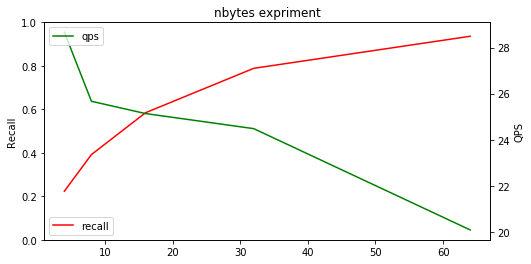
As we can see, when the number of byte grows, the recall get higher and higher, but the QPS drops obviously.
Experiments with faiss
We do experiments on SIFT1M, VGG1M and VGG10M to compare the recalls with faiss. We use some algorithm implemented with faiss and we use Vearch to represent our algorithm.
Models
Here we show the parameters we set for used models. When the parameters in the table are empty, there are no corresponding parameters in the models. And the parameters of links, efSearch and efConstruction are defined in faiss of hnsw.
| model | ncentroids | nprobe | bytes of SIFT | bytes of VGG | links | efSearch | efConstruction |
|---|---|---|---|---|---|---|---|
| pq | | 32 | 64 | |||||
| ivfpq |256 | 20 | 32 | 64 | ||||
| imipq | 2^(2*10) | 2048 | 32 | 64 | |||
| opq+pq | 32 | 64 | |||||
| hnsw | 32 | 64 | 40 | ||||
| ivfhnsw | 256 | 20 | 32 | 64 | 40 | ||
| Vearch | 256 | 20 | 32 | 64 | |||
Result
recalls of SIFT1M:
| model | recall@1 | recall@10 | recall@100 |
|---|---|---|---|
| pq | 0.6274 | 0.9829 | 0.9999 |
| ivfpq | 0.6167 | 0.9797 | 0.9960 |
| imipq | 0.6595 | 0.9775 | 0.9841 |
| opq+pq | 0.6250 | 0.9821 | 1.0000 |
| hnsw | 0.9792 | 0.9867 | 0.9867 |
| ivfhnsw | 0.9888 | 0.9961 | 0.9961 |
| Vearch | 0.8649 | 0.9721 | 0.9722 |
recalls of VGG1M :
| model | recall@1 | recall@10 | recall@100 |
|---|---|---|---|
| pq | 0.5079 | 0.8922 | 0.9930 |
| ivfpq | 0.4985 | 0.8792 | 0.9704 |
| imipq | 0.5077 | 0.8618 | 0.9248 |
| opq+pq | 0.5213 | 0.9105 | 0.9975 |
| hnsw | 0.9496 | 0.9550 | 0.9551 |
| ivfhnsw | 0.9690 | 0.9744 | 0.9745 |
| Vearch | 0.9536 | 0.9582 | 0.9585 |
recalls of VGG10M :
| model | recall@1 | recall@10 | recall@100 |
|---|---|---|---|
| pq | 0.5842 | 0.8980 | 0.9888 |
| ivfpq | 0.5913 | 0.8896 | 0.9748 |
| imipq | 0.5925 | 0.8878 | 0.9570 |
| opq+pq | 0.6126 | 0.9160 | 0.9944 |
| hnsw | 0.8877 | 0.9069 | 0.9074 |
| ivfhnsw | 0.9638 | 0.9839 | 0.9843 |
| Vearch | 0.9272 | 0.9464 | 0.9468 |
Cluster experiments
First, we do experiments by searching on cluster only with vgg features. Then, we experiment with the vgg features and filter the search using an integer field to compare the time consumed and QPS with the vgg features only. In the following section, we use searching with filter or without filter to specify the experiment method mentioned earlier. For different size of experiment data, we use different Vearch cluster. We use 3 masters, 3 routers and 5 partition services for VGG100M. For VGG500M, we use the same size of master and router with VGG100M but 24 partition services. We use 3 masters, 6 routers and 48 partition services to deal with the VGG1B.
Result
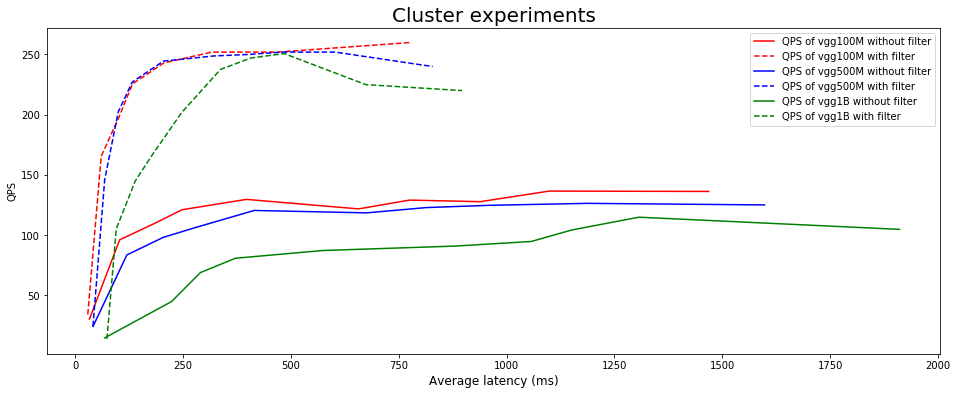
The growth shape of QPS is more like inverted J-shaped curve which means the growth of QPS basically have no obvious change when average latency exceed one certain number.